A data workbench where the graph is the interface
exuvia turns an analysis into a graph of plain Python and SQL files. Schedule any node on its own, keep every output it produces, and work with an AI agent that reads, writes, runs and debugs the graph alongside you.
pip install exuvia
Loading the graph.
From a list of cells to a graph of files
A lobster grows by leaving its old shell behind. Data tools have grown the same way: each generation kept what worked and shed what hurt. Here is one five-step analysis in all three.

Jupyter
Code, output and prose in one document.
You can try an idea in seconds. But cells run in whatever order you run them, and the kernel remembers every result, so the file on disk and the state in memory drift apart.
marimo
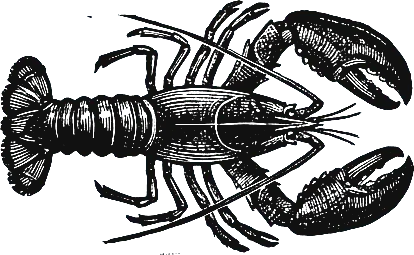
The notebook becomes a reactive graph.
marimo reads which cells depend on which, re-runs the dependents when something changes, and saves the notebook as a plain Python file. The hidden state is gone, and the notebook fits in git.
exuvia
The graph becomes the interface.
Each node is its own file with its own schedule, and every run leaves a stored output behind. An AI agent reads, writes, runs and debugs nodes on the same canvas you work on.
A node is a function in a file
There is no project format to learn and no graph to declare. You write ordinary Python and SQL, and exuvia reads the rest from it.
"""20-day annualized realized volatility per ticker."""
import exuvia

@exuvia.node(
    schedule="0 18 * * 1-5",
    cascade=True,
)
def rolling_vol(returns):
    out = returns.sort_values("date").copy()
    out["vol_20d"] = out.groupby("ticker")["ret"].transform(
        lambda s: s.rolling(20).std() * 252**0.5
    )
return out.dropna()-- Latest vol by sector.
-- schedule: */30 9-16 * * 1-5
select u.sector, avg(v.vol_20d) as avg_vol
from universe u join rolling_vol v using (ticker)
group by 1The file is the node
One file in
nodes/, named after the node. It diffs, reviews and merges like the rest of your code.A schedule of its own
A cron on this node, not on the whole graph. You can pause it from the UI without touching the file.
Cascade, until nothing changes
When an upstream output changes, this node re-runs. When its own output comes out identical, the cascade stops here.
A parameter is an edge
returnsis the node upstream. exuvia reads the graph from the source without running it, so a broken node still appears, with its error.The return value is kept
It is stored as Parquet under a hash of its content. Same code and same inputs is a cache hit, and earlier outputs stay readable.
In SQL, upstream nodes are tables
A SQL node runs in DuckDB and names its upstream nodes in
fromandjoin. Schedules and charts go in header comments.
One command opens the workbench
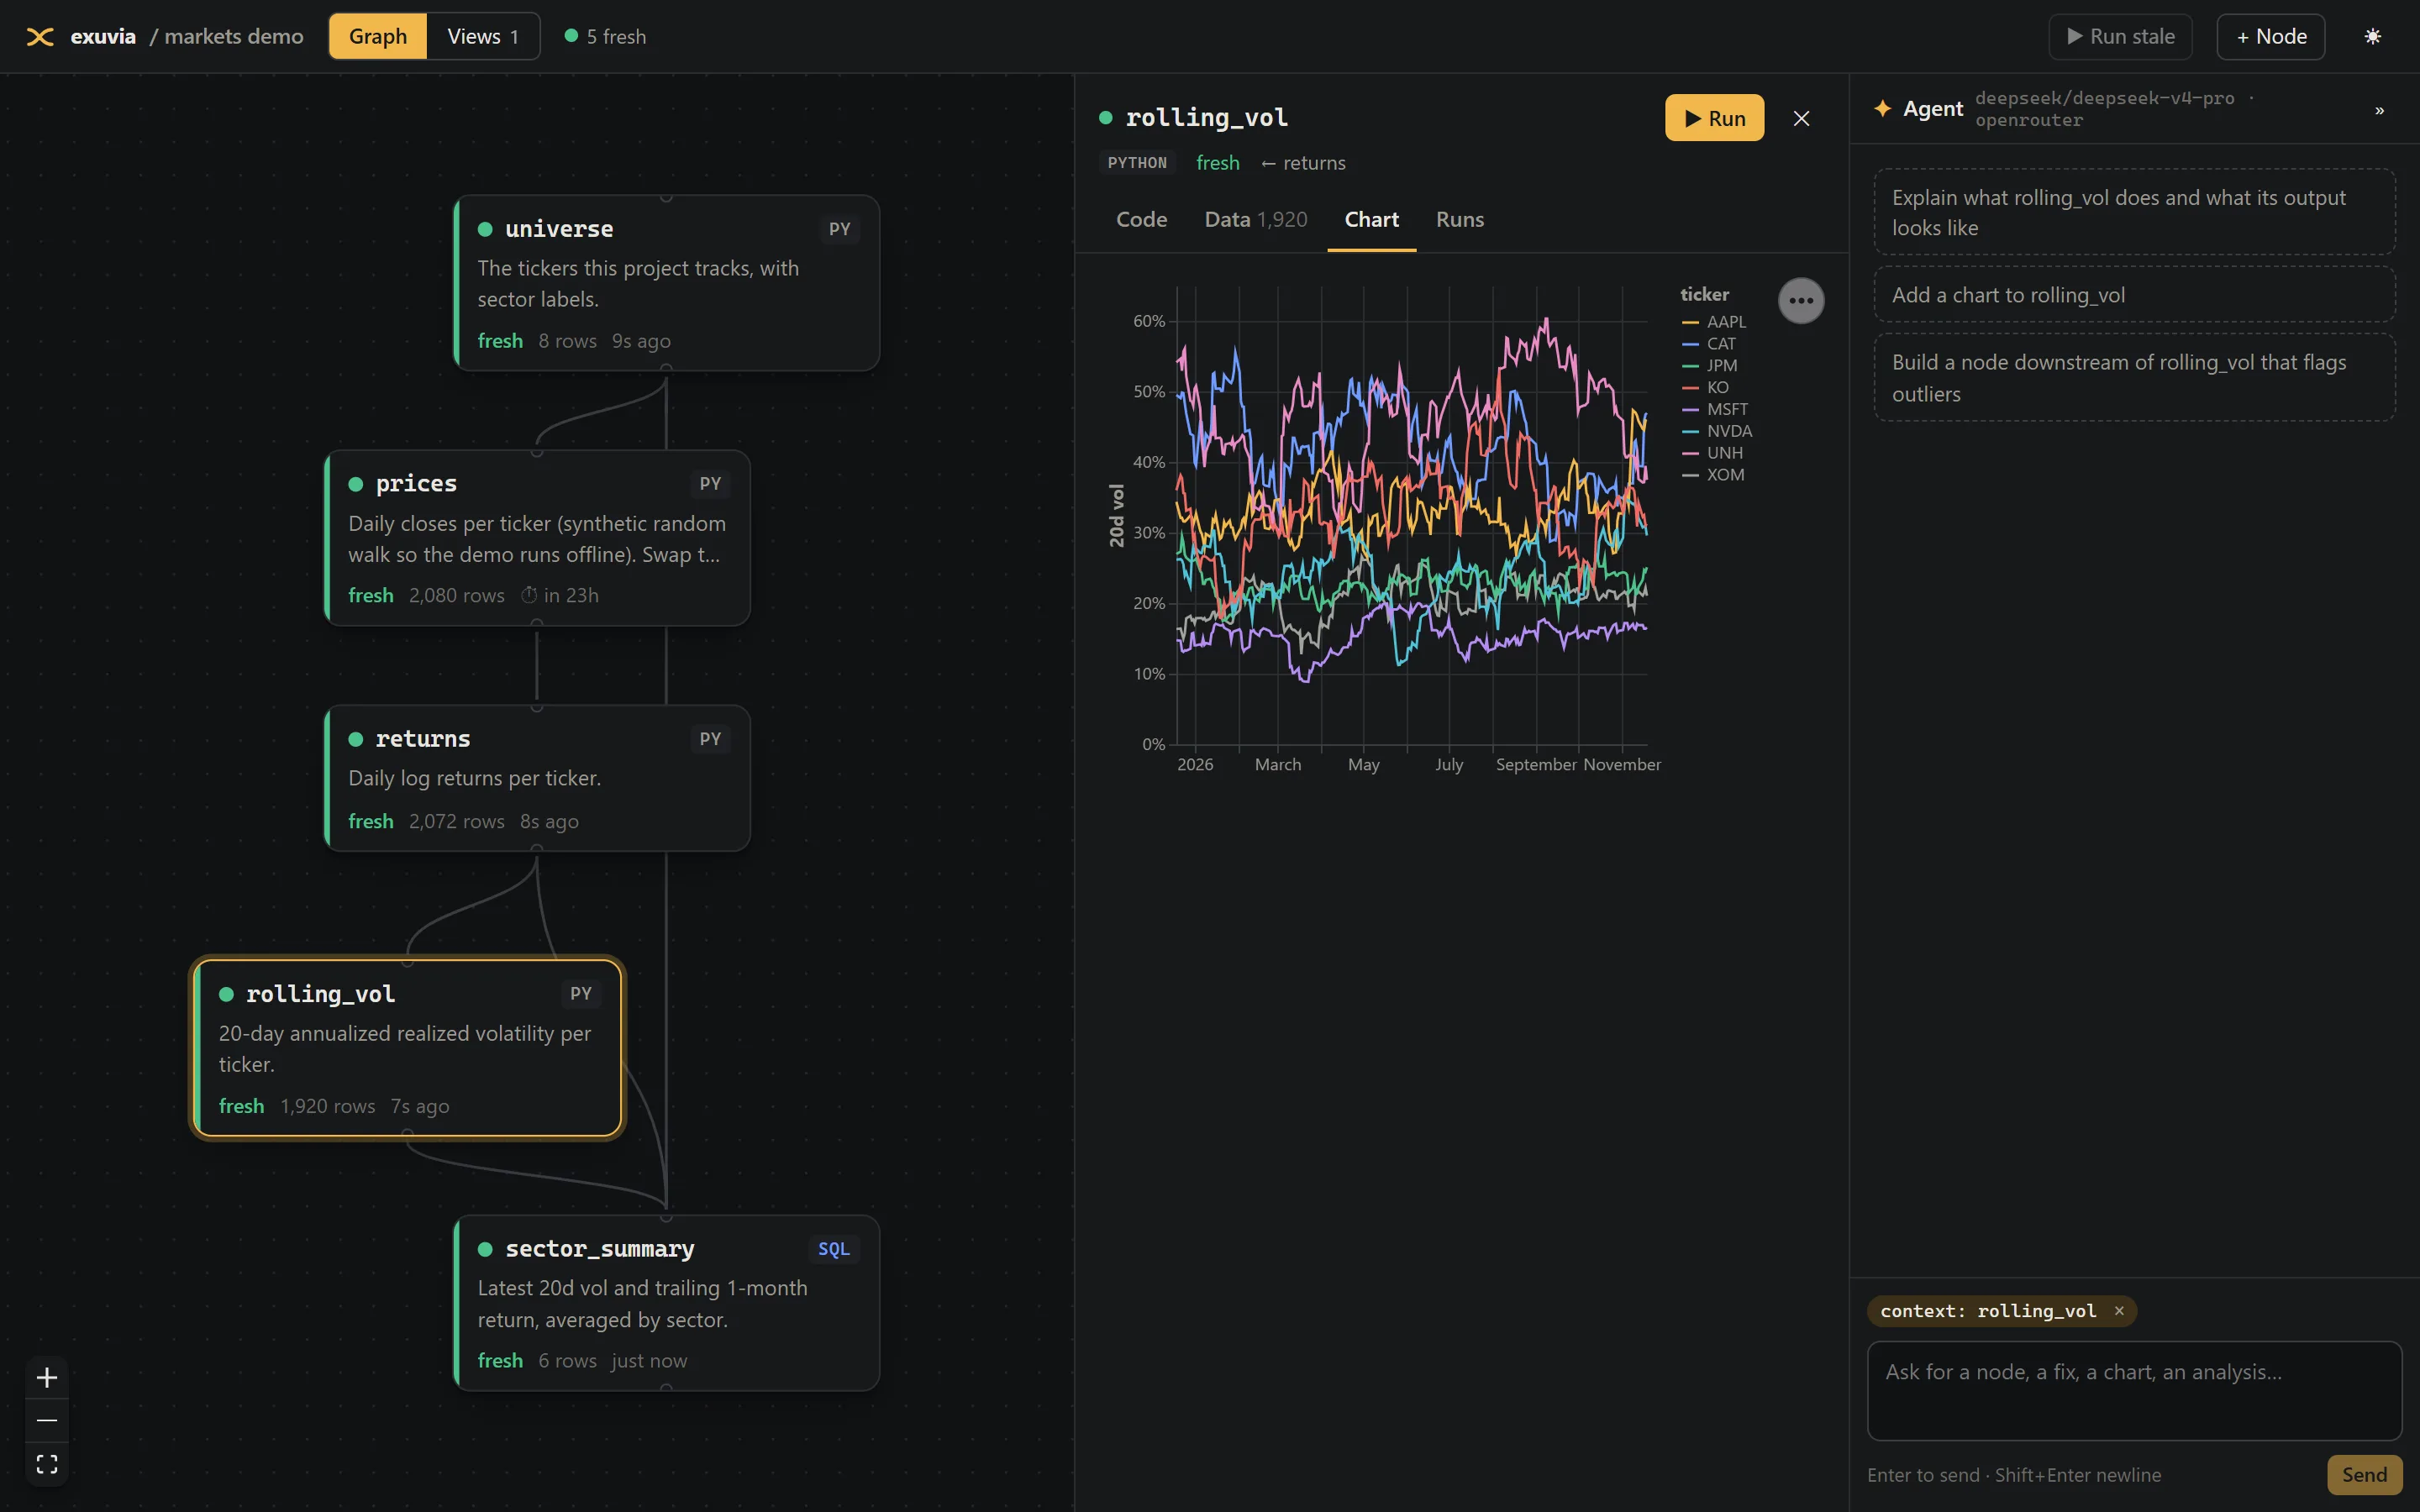
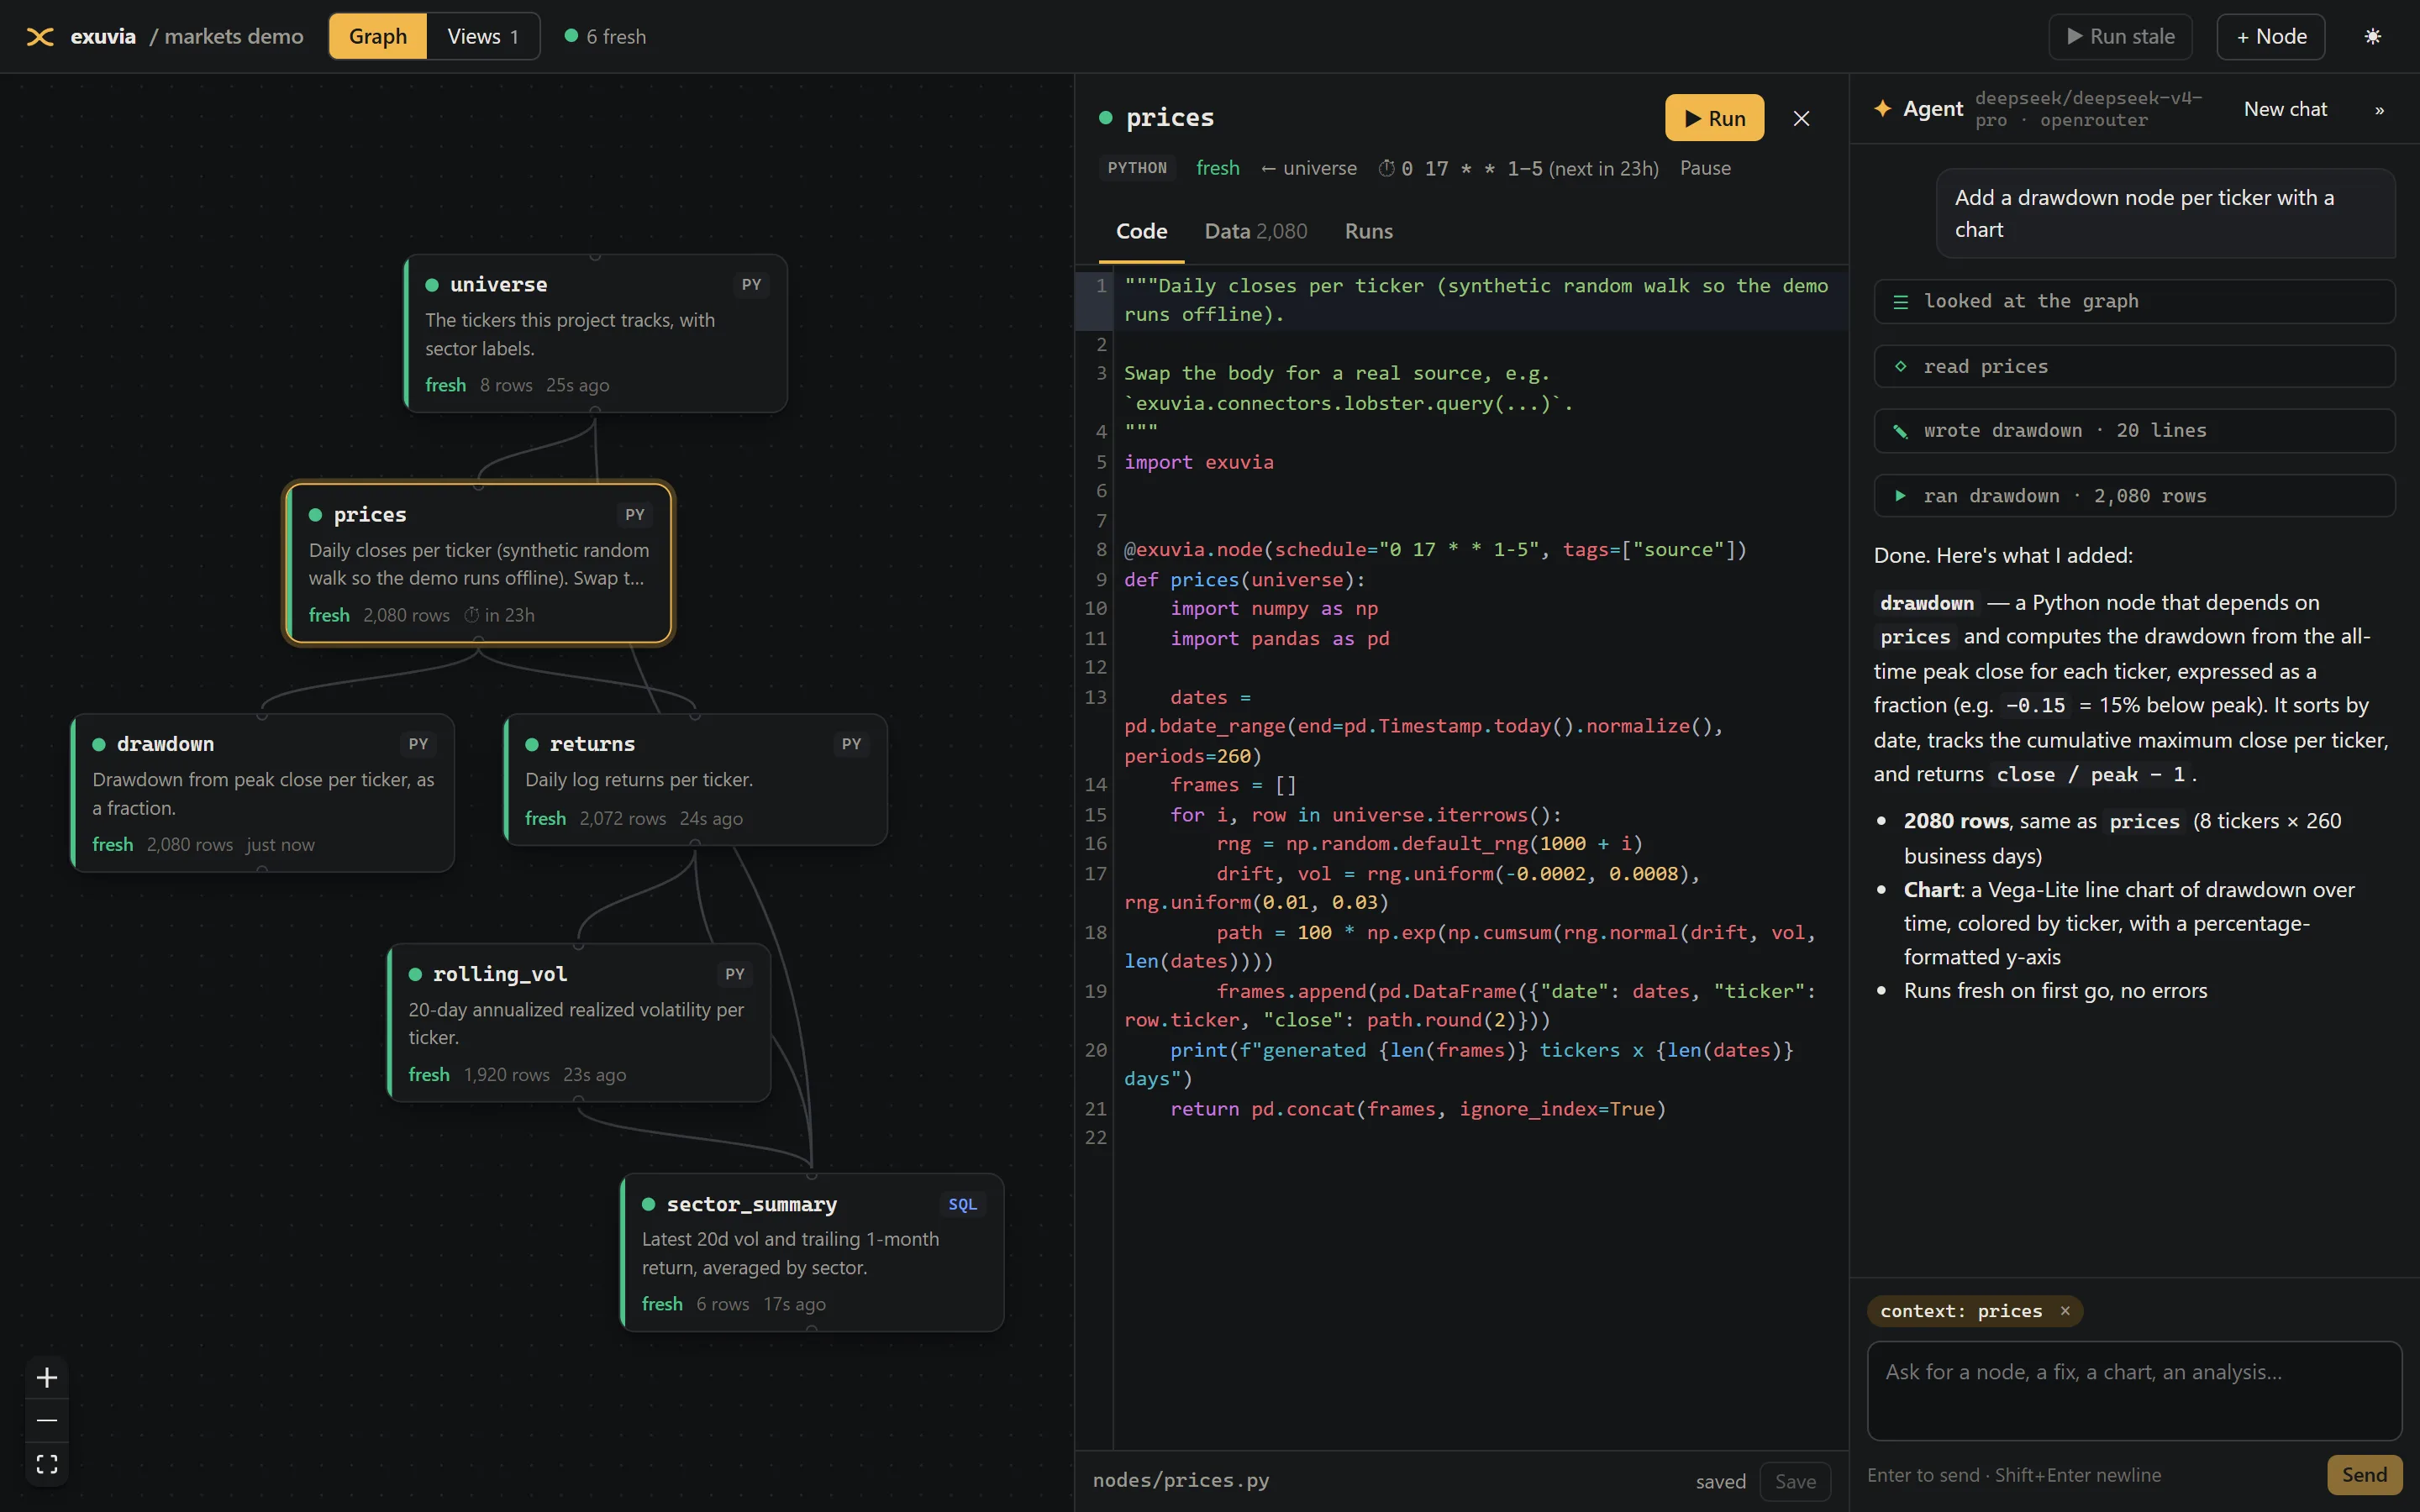
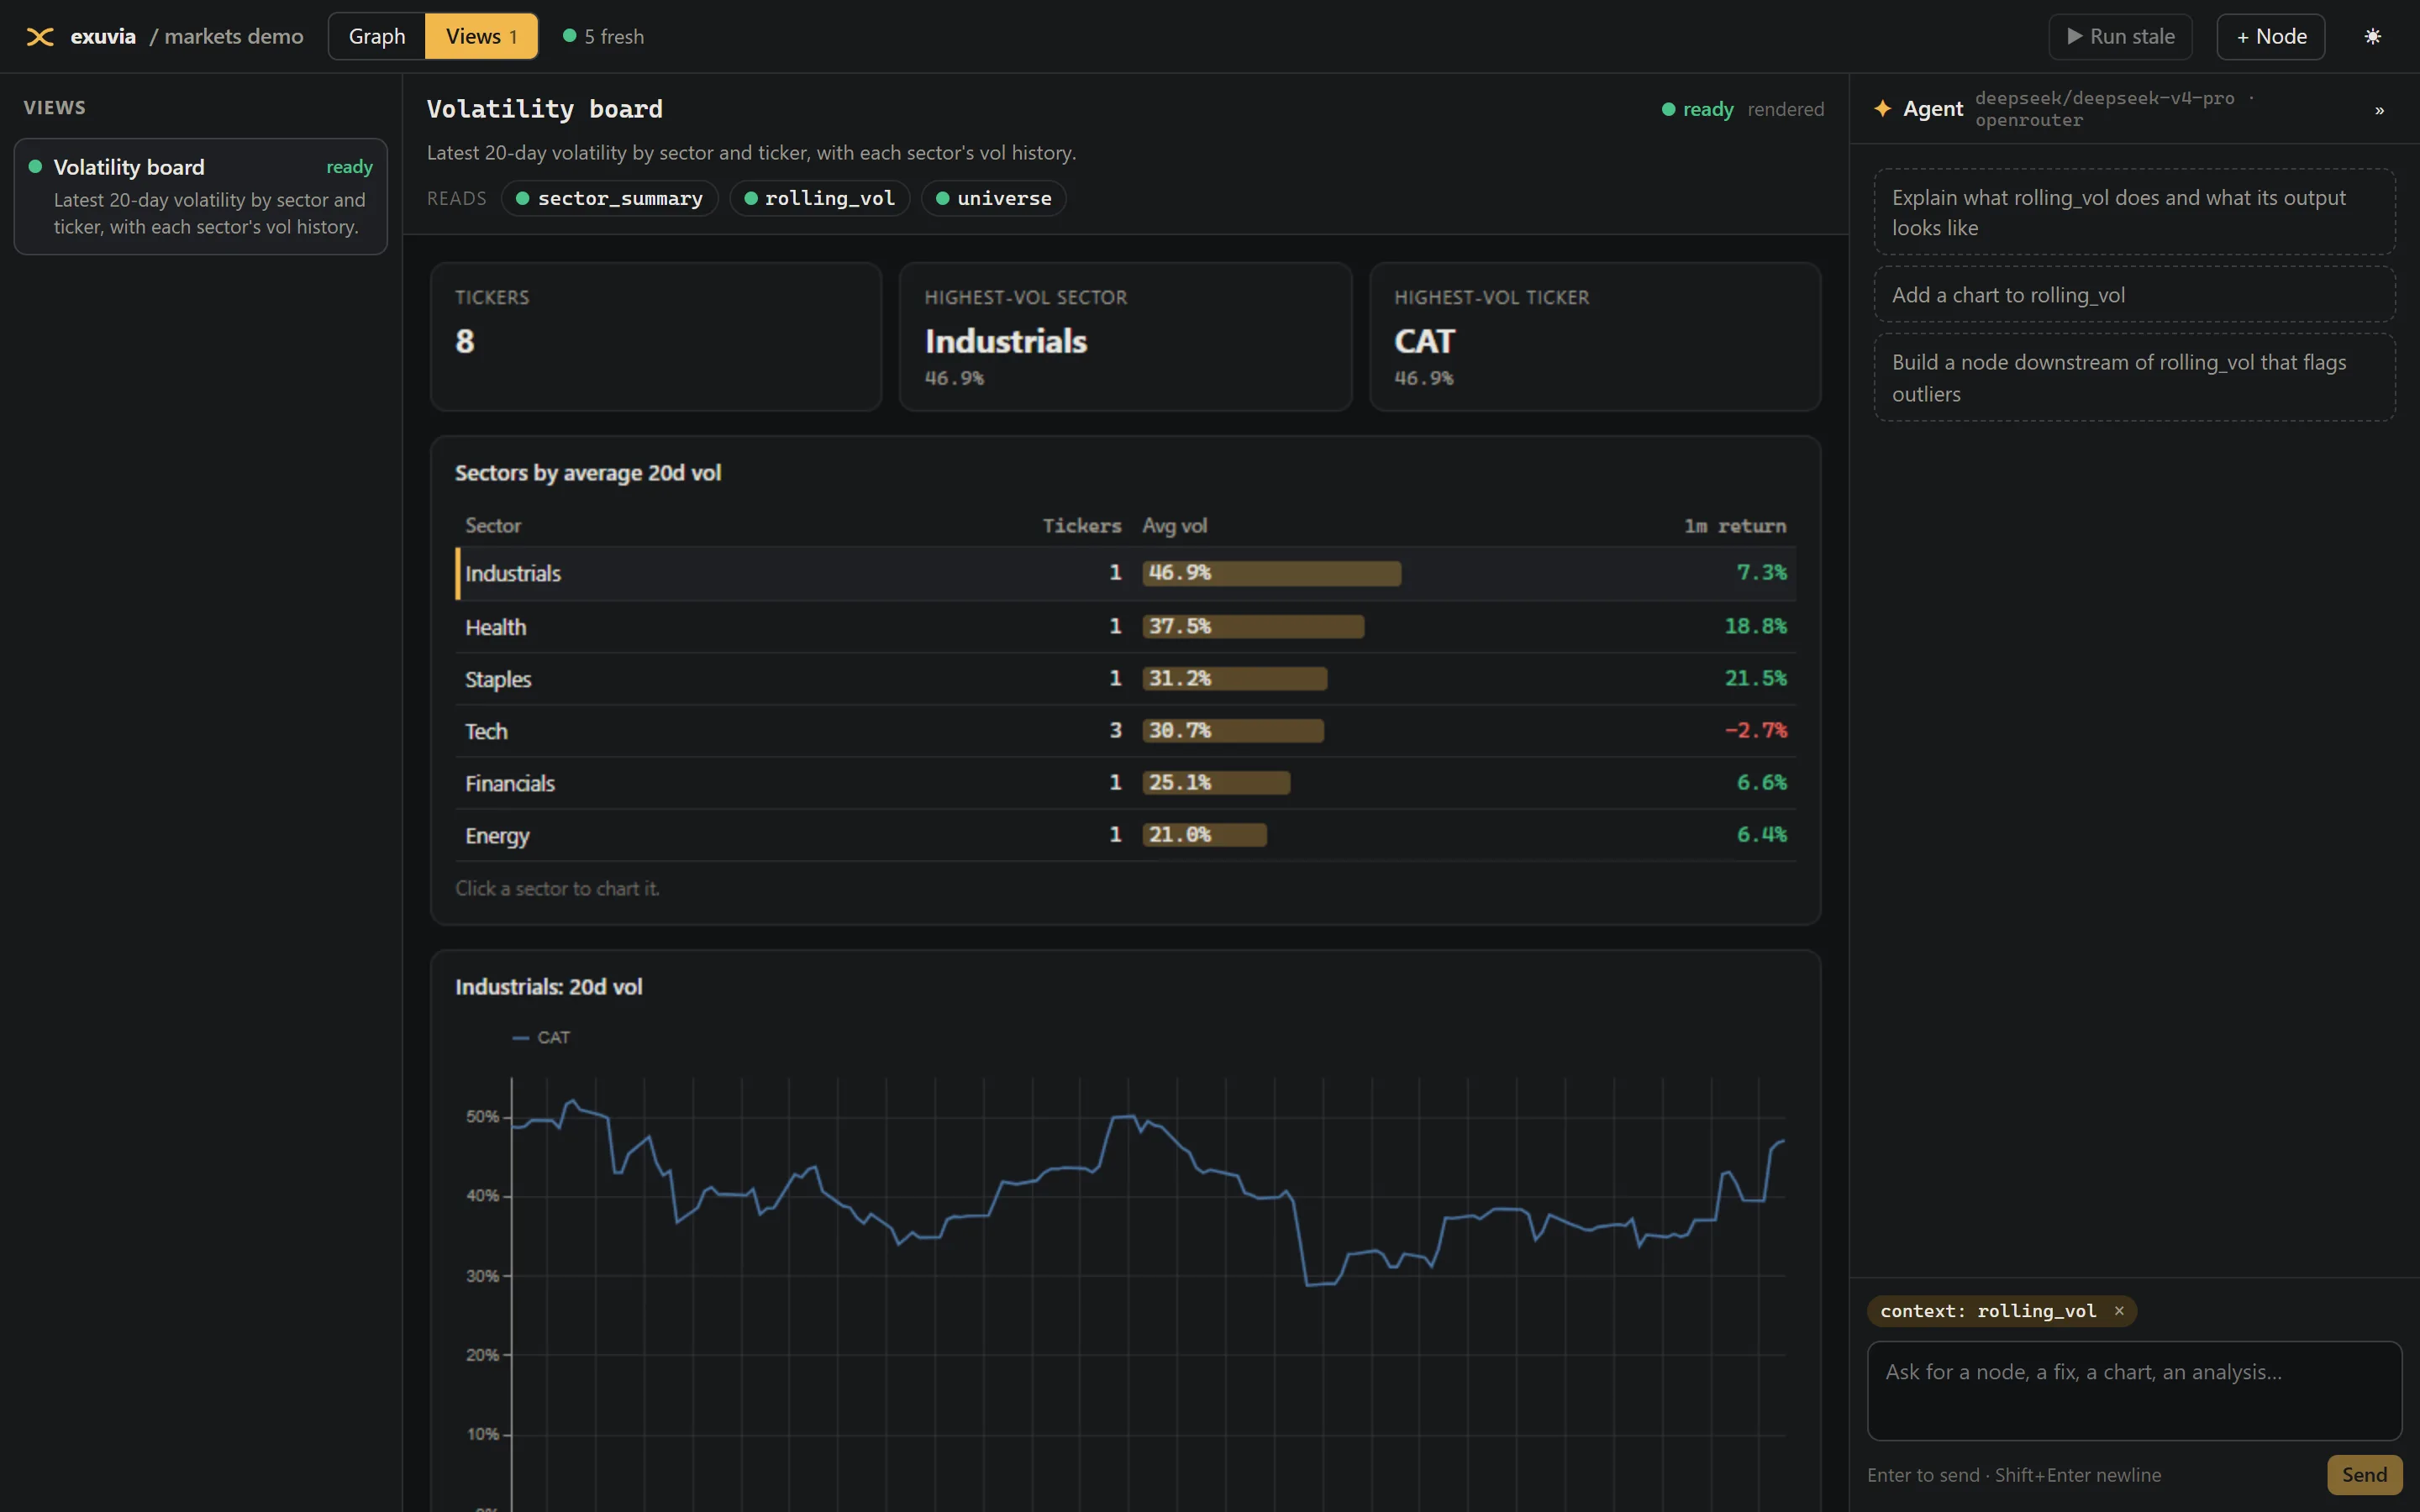
exuvia serve starts the UI, the API and the scheduler on your machine. These are screenshots of it running the example project.
The interface is front-end code, not Python
In a notebook the UI is assembled from Python: widget calls, or HTML and JavaScript held in strings. In exuvia, Python and SQL compute, and the interface is a view: TypeScript, React and CSS in files of their own. This is the view in the screenshot above.
{
  "title": "Volatility board",
  "runtime": "react",
  "entry": "App.tsx",
  "reads": ["sector_summary", "rolling_vol", "universe"]
}import { useState } from "react";
import { rows, useQuery, useTable } from "exuvia";
import { VolChart } from "./VolChart";
import "./styles.css";
export default function App() {
const sectors = useTable("sector_summary");
const latest = useQuery(`
select v.ticker, u.sector, v.vol_20d
from rolling_vol v join universe u using (ticker)
qualify row_number() over (
partition by v.ticker order by v.date desc) = 1`);
const [picked, setPicked] = useState<string | null>(null);
const bySector = rows<Sector>(sectors.data);
const sector = picked ?? bySector[0]?.sector ?? null;
// …
return (
<main className="board">
{bySector.map((s) => (
<tr key={s.sector} onClick={() => setPicked(s.sector)}>
{/* … */}
</tr>
))}
{sector && <VolChart sector={sector} />}
</main>
);
}A folder of front-end files
A view lives in
views/, besidenodes/: a manifest, an entry component, and whatever else it needs. Every file is versioned like a node file, and diffs like one.The reads list is all it can see
The view gets the outputs of the nodes it names and nothing else. The same list draws its edges on the graph and tells you when it is ready, stale, or missing an output.
Data arrives typed
useTablereturns a node's output as an Arrow table, with real column types. Nothing is rendered to HTML in Python and passed along as text.SQL over what it reads
useQueryruns DuckDB SQL over the nodes the view reads. When a run replaces one of those outputs, the hooks reload by themselves. A view never starts a run.Components, state and CSS as usual
Split the view into files, keep state in React, style it with a stylesheet. React, Vega-Lite and Arrow ship with exuvia, and the files compile in the browser, so there is no build step and no install.
Sandboxed by default
A view runs in a frame with no network, no cookies and no API token. Its only way to data is asking the page, which answers for the nodes in
reads.
Ask the agent for one. It writes views with the same kind of tools it has for nodes, and what it writes runs in the same sandbox.
Not a React app? Outside the workbench the same outputs are plain HTTP: Arrow streams and Parquet files, for an app in any language.
An agent with tools over the graph
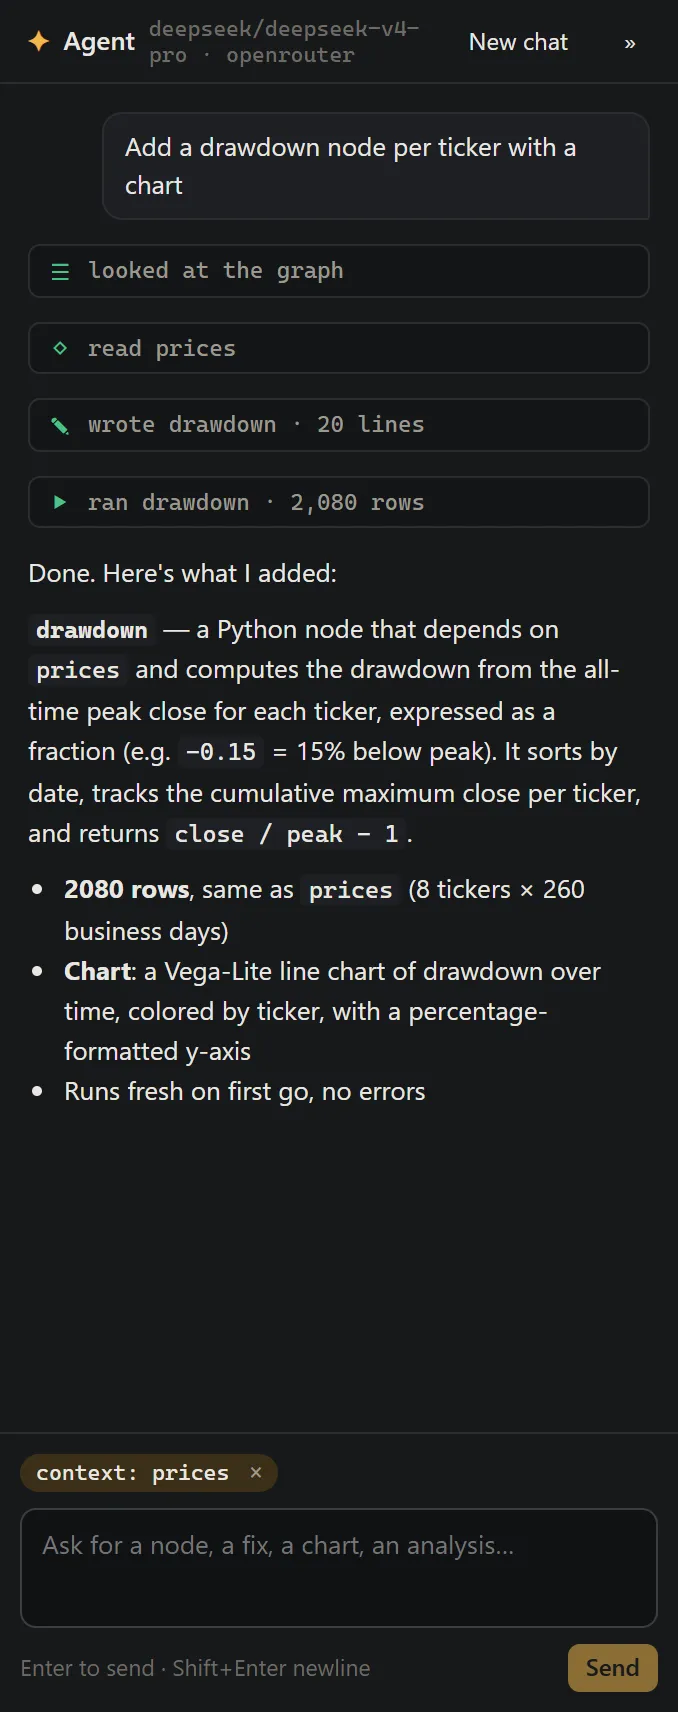
The agent is not a chat box beside your work. It has the same handles you do: it lists and reads nodes, writes them, runs them, and queries their outputs with DuckDB.
- It looks at the real column names before it writes a line.
- It runs what it writes, and reads the traceback when a run fails.
- Every tool call shows in the conversation, and the nodes it touches flash on the canvas.
- What it leaves behind are ordinary files, with every earlier version kept and restorable.
Bring your own model
| Model | Set |
|---|---|
| Claude | ANTHROPIC_API_KEY |
| Any model on OpenRouter | OPENROUTER_API_KEY |
| A local or self-hosted model | EXUVIA_BASE_URL and EXUVIA_MODEL |
The model needs to support function calling. Providers, project notes and sessions
Between a notebook and an orchestrator
Notebooks are quick to work in and awkward to run every day. Orchestrators run every day and are slow to work in. exuvia keeps the notebook's loop and gives each node the orchestrator's schedule.
| Notebooks | Orchestrators | exuvia | |
|---|---|---|---|
| Unit of work | A cell | A task or an asset | A node file |
| Dependencies | Hidden state, or reactive cells | Declared in code | Function parameters and SQL table names |
| Scheduling | None | The whole DAG, or asset jobs | Per node, by cron, cascading downstream |
| Iteration loop | Fast | Slow: deploy first | Fast: edit, run, see the data |
| Custom UI | Widgets and HTML built from Python | None: you build a separate app | Views: TypeScript, React and CSS in files of their own |
| On disk | Notebook JSON | A Python package | One plain file per node |
When the project outgrows your laptop
- Run parameters and replays
- Run the graph for a date and keep one output per date. Replay a range, and query every run of a node as one table.
- Many projects, one process
- Serve every project under one directory from a single process.
- Remote executors
- Keep the control plane on your laptop and run nodes in a container on Cloud Run, Fly, Kubernetes or Cloudflare.
- Your storage
- Outputs go to disk or any S3-compatible bucket. Run history goes to SQLite or Postgres.
- Headless runs
exuvia runbrings a project up to date and exits non-zero when a node fails, so it fits CI and cron.- An HTTP API
- Everything the UI does is a plain HTTP call, with Arrow streams and Parquet files when you want the data itself.
Running in four steps
From an empty folder to a graph with an agent on it.
Install it
exuvia is one Python package with the web UI inside. It needs Python 3.11 or newer.
pip install exuviaCreate a project and open it
A project is a folder. This makes one with a first node, then serves the workbench at 127.0.0.1:7420.
exuvia init my-research
exuvia serve my-research
Add a node
Save a file in nodes/. The parameter name is the dependency. The canvas picks the file up by itself.
nodes/squares.pyimport exuvia @exuvia.node() def squares(hello): return hello[hello["y"] > 1]Turn on the agent
Put a model key in the project's .env and restart. Then ask for a node, a fix or a chart.
echo "ANTHROPIC_API_KEY=sk-ant-..." >> my-research/.env
exuvia is an early release. See what it does not do yet.